Overview
A Prometheus exporter that runs speedtest.net measurements and exports the results as metrics.
![]()
![]()
Features
- Periodic speedtest measurements
- Prometheus metrics for:
- Ping latency (average, low, high)
- Download performance (bandwidth, bytes, elapsed time, latency)
- Upload performance (bandwidth, bytes, elapsed time, latency)
- Configurable test intervals
- Multi-architecture support (amd64, arm64, armv7)
- Docker support
- Minimal resource footprint (<1MiB RAM usage)
 Container memory usage example
Quick Start
The fastest way to get started is using our docker-compose file which includes: - Speedtest exporter (running tests every 30 minutes) - Prometheus (pre-configured to scrape the metrics) - Grafana (with auto-provisioned dashboard)
# Download the docker-compose.yml
curl -O https://raw.githubusercontent.com/lpicanco/prometheus-speedtest-exporter/main/docker-compose.yml

# Start the stack
docker-compose up -d
Then access Grafana at http://localhost:3000 (admin/admin) and you'll find: - Pre-configured Prometheus data source - Auto-provisioned Internet Speed dashboard - Real-time metrics for download, upload, and ping latency
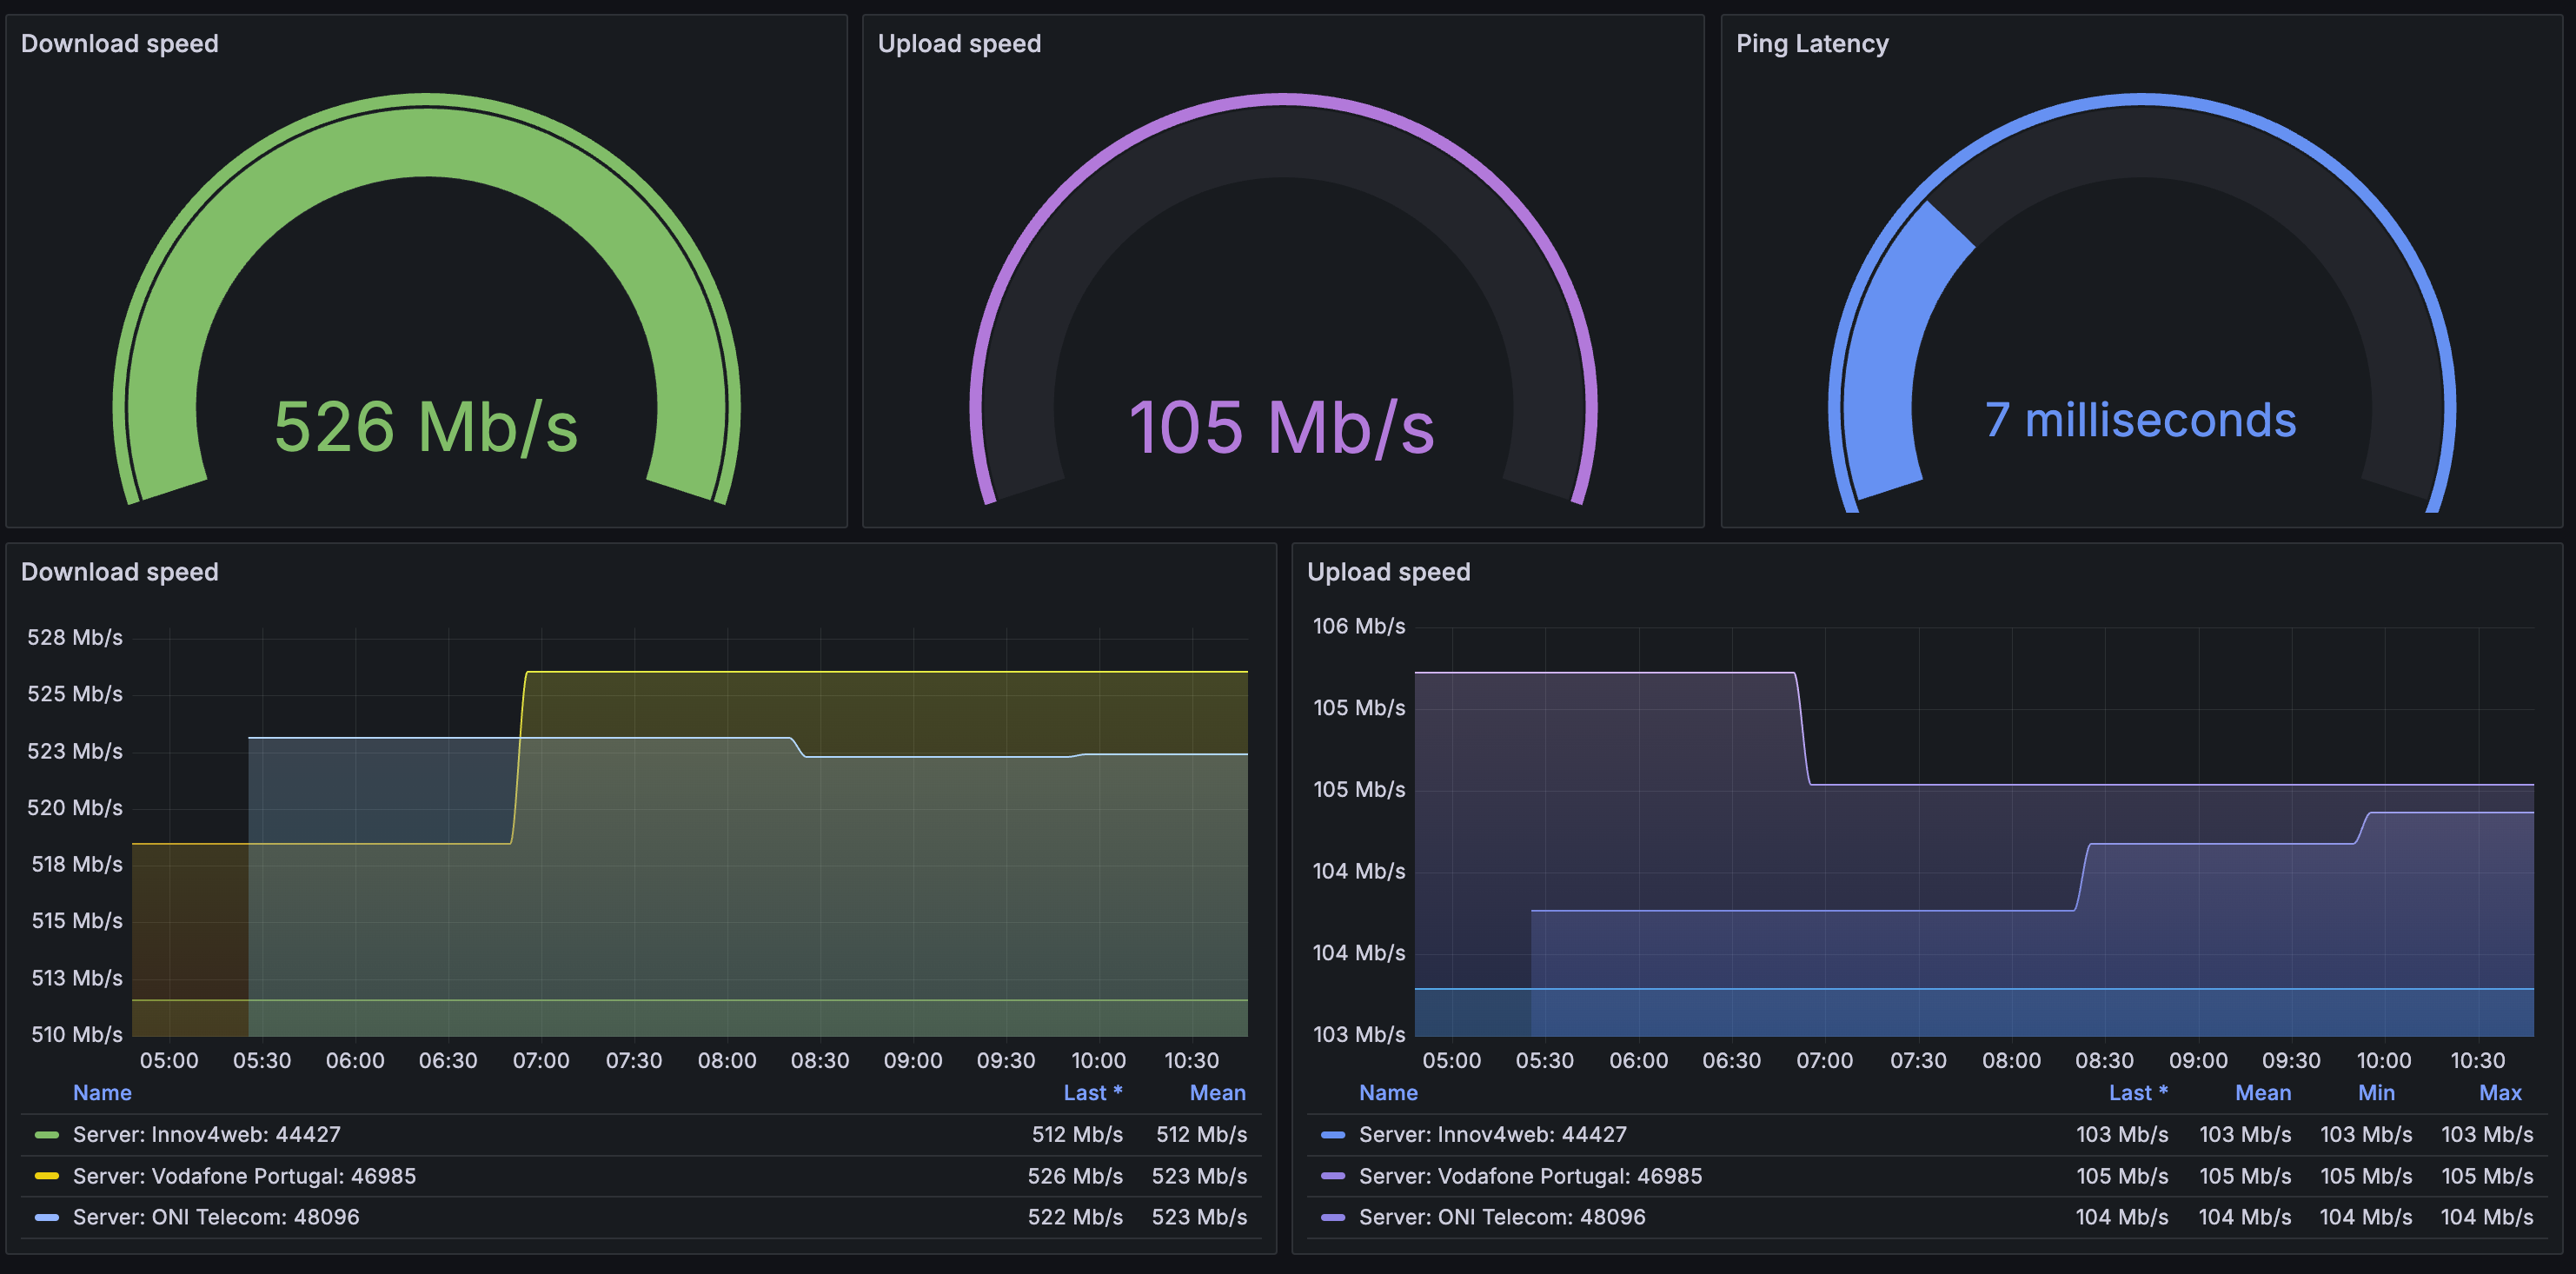
Grafana Dashboard
A pre-configured Grafana dashboard is available to visualize your internet speed metrics:
You can import this dashboard in two ways:
1. Using the Grafana.com dashboard ID: 22651
2. Directly from Grafana.com marketplace
Documentation
For detailed documentation, please visit our GitHub repository.