Grafana Dashboard
A pre-configured Grafana dashboard is available to visualize your internet speed metrics.
Dashboard Features
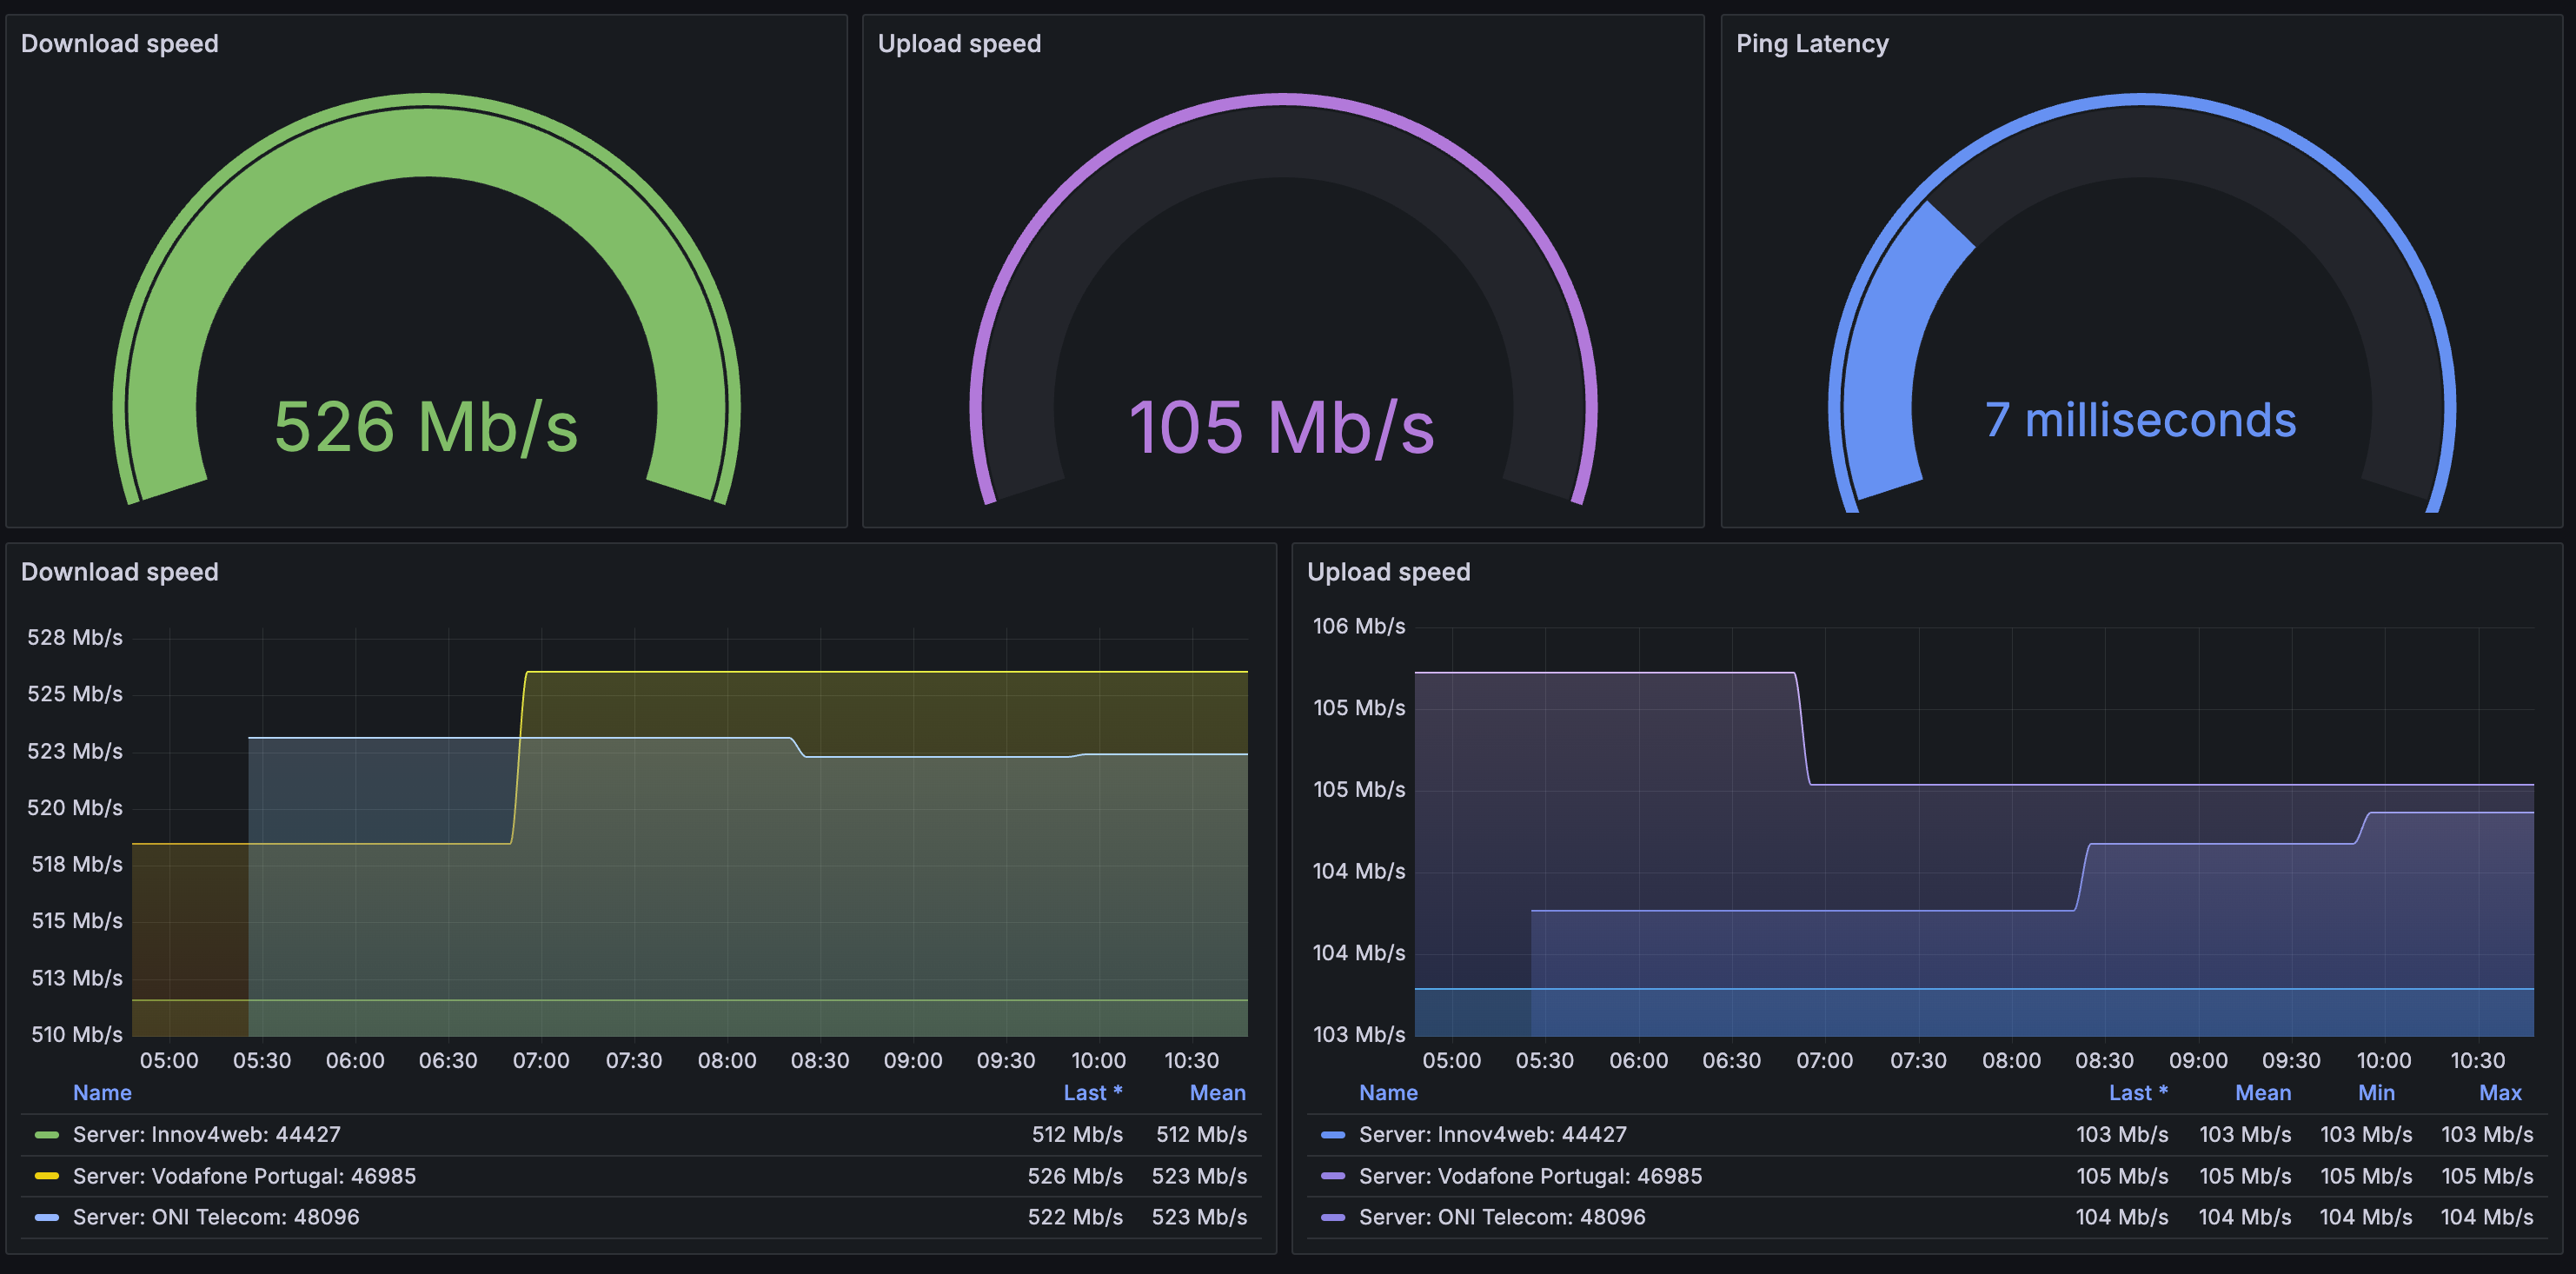
The dashboard includes: - Download and upload speed trends - Ping latency statistics - Jitter measurements - Historical performance graphs - Server information
Installation
The dashboard is available on Grafana.com: Internet Speed Dashboard
You can import it using:
- Dashboard ID: 22634
- Direct import from Grafana.com marketplace
Docker Compose Setup
If you're using our Docker Compose setup, the dashboard is automatically provisioned and ready to use.
- Access Grafana at
http://localhost:3000 - Login with default credentials (admin/admin)
- Navigate to Dashboards -> Internet Speed
Screenshots
Manual Setup
If you're setting up the dashboard manually:
- Add Prometheus as a data source in Grafana
- Import the dashboard using ID
22634 - Select your Prometheus data source
- Save and enjoy your internet speed metrics!